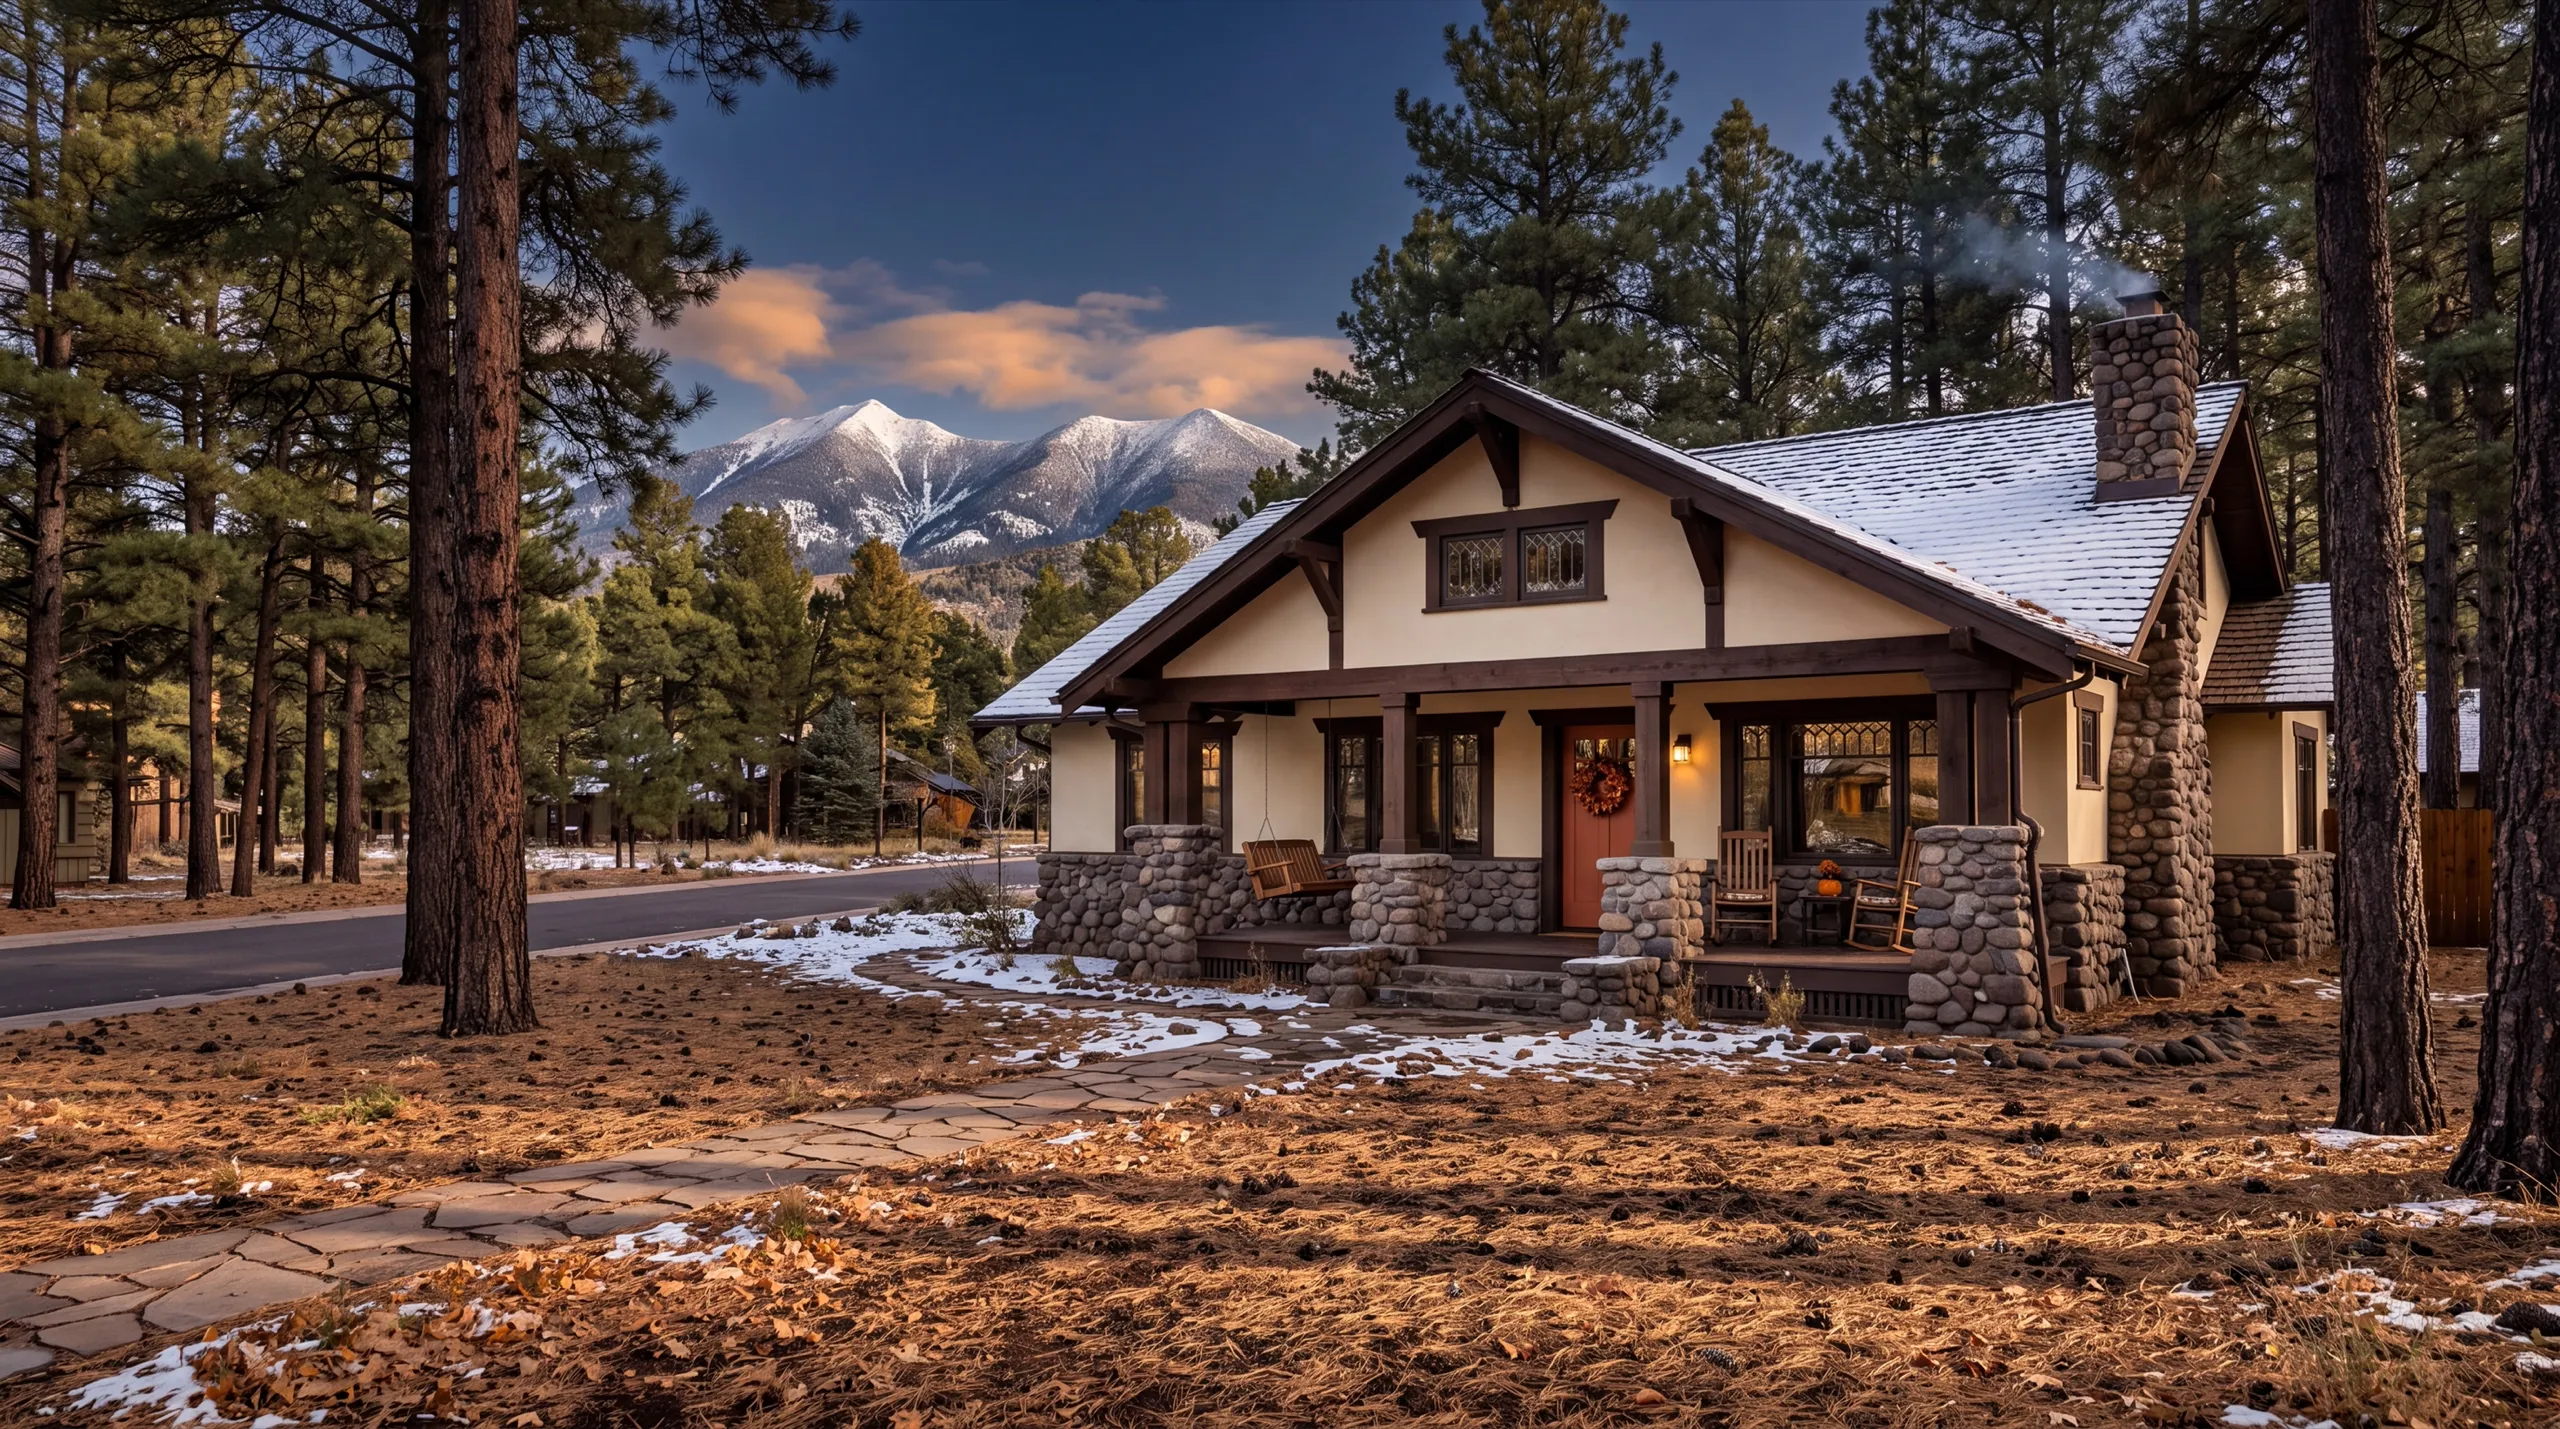
Flagstaff & Coconino County housing market
$723,381
Redfin's median sale in September
With 4.4 months of supply, Flagstaff & Coconino County is a balanced market right now: homes priced right still sell, and homes priced high sit. Type your address to see your range, free.
From Arizona county records · Veteran and first responder owned · No account needed
Bryce Henderson · real estate investor, veteran and paramedic · Newest figures: September 2026
Selling in Flagstaff & Coconino County right now
With 4.4 months of supply, Flagstaff & Coconino County is a balanced market right now: homes priced right still sell, and homes priced high sit.
- Under 4 months: leans toward sellers
- 4 to 6 months: balanced
- 6 or more: buyers have the upper hand
Each dot is one of Arizona's other 23 local markets with a page here, by months of supply.
The typical listing here has been on the market 88 days.
About 2 in 10 listings have cut their asking price.
Homes that sold went for about 97.1% of their asking price, and 11% sold above asking.
If you're thinking about selling, the report on your own home is the place to start. A call with our team can tell you what selling here would really leave you.
Listings, price cuts and days on market: Realtor.com, September 2026. Sale-to-list and above-asking: Redfin, September 2026.
More on Flagstaff & Coconino County
The numbers right now
- Homes for sale with a price cutRealtor.com, September 2026, to the nearest ten150
- Homes sold in Septemberabout 2 fewer than a year ago, Redfin172
- Change on the typical home in 5 yearsZillow Home Value Index+$113,800
Months to sell every listing: Redfin, which divides the homes it counts as listed by its monthly sales. Homes for sale, price cuts and days on market: Realtor.com. Home values: Zillow Home Value Index. "A usual September" is the average for September in every earlier year of Realtor.com data.
ZIP codes in Flagstaff & Coconino County
Find your ZIP code. Fastest to sell: 86015 (Bellemont) at 46 days. Slowest: 86320 (Ash Fork) at 145 days.
| ZIP | Place | Typical value | 12 months | For sale | vs. a usual September | Price cuts | Days on market |
|---|---|---|---|---|---|---|---|
| 86005 | Flagstaff | $724k | +$6,300 | 120 | −7 | 2 in 10 | 68 |
| 86001 | Flagstaff | $658k | +$1,400 | 146 | +59 | 3 in 10 | 91 |
| 86004 | Flagstaff | $615k | −$200 | 166 | +56 | 3 in 10 | 86 |
| 86018 | Parks | $598k | +$4,900 | 9 | −5 | n/a | n/a |
| 86017 | Munds Park | $583k | −$2,900 | 40 | −3 | 2 in 10 | 83 |
| 86015 | Bellemont | $551k | −$10,300 | 15 | +6 | 2 in 10 | 46 |
| 85931 | Forest Lakes | $543k | +$200 | 21 | +7 | 2 in 10 | 130 |
| 86024 | Happy Jack | $502k | +$8,400 | 50 | +22 | 1 in 10 | 99 |
| 86046 | Williams | $436k | +$3,400 | 89 | +40 | 2 in 10 | 101 |
| 86038 | Mormon Lake | $385k | −$3,600 | 5 | −3 | n/a | n/a |
| 86040 | Page | $368k | −$200 | 57 | +30 | 1 in 10 | 87 |
| 86022 | Fredonia | $300k | +$2,600 | 9 | +4 | n/a | n/a |
| 86320 | Ash Fork | $205k | +$8,700 | 17 | +2 | 1 in 10 | 145 |
Each ZIP's typical value from Zillow; listings, price cuts and days on market from Realtor.com, September 2026. Price cuts and days on market are left out where fewer than 10 homes are for sale. Sorted from highest typical value to lowest.
Since you bought
The typical home's value at the end of each year since 2000. Find the year you bought to see what the typical home here has done since.
Each row: the typical value that December, then the change to today's typical value.
- 2005$287,312+$331,600
- 2010$228,971+$389,900
- 2015$289,495+$329,400
- 2020$411,780+$207,100
- 2022$571,486+$47,400
- 2025$620,485−$1,600
Each year is December's typical home value (the latest month for this year), Zillow Home Value Index, September 2026. The change is to today's typical value, not to any one home.
The owners here
From property records for 40,582 owner-occupied homes: county assessor records, with ownership, mortgage and sale details from a private property data company. The large number on each tile is to the nearest ten. A figure is shown only when at least 200 records support it and it is known for at least 6 in 10 owner-occupied homes here.
What's driving prices here
- Typical rent a monthabout $0 less than a year ago$2,128
Years of income compares Zillow's typical home value with the typical household income from Census Bureau estimates, and with the 2000 to 2019 average of the same comparison. Population: Census Bureau American Community Survey, 2020 to 2024 against 2015 to 2019. Moves: Census Bureau population estimates. Permits: Census Building Permits Survey. Rent: Zillow Observed Rent Index.
What a buyer pays here each month
Payment on the typical home value with a standard down payment, at the latest weekly average 30-year mortgage rate published by Freddie Mac (week of October 15, 2026). Property tax is the typical home value times a tax rate from Census Bureau figures: median taxes paid divided by median home value. Insurance is the 2022 average premium from U.S. Treasury data, brought to today with the Bureau of Labor Statistics price index for homeowners insurance premiums.
Flagstaff & Coconino County housing market questions, answered
What is my home worth in Flagstaff & Coconino County?
Zillow puts the typical home in Flagstaff & Coconino County at $618,865, but your home's number depends on what homes like yours sold for. Type your address to see your range, free.
Are home prices dropping in Flagstaff & Coconino County?
About the same. Zillow's typical home value in Flagstaff & Coconino County is $618,865, within $1,000 of a year ago and about $113,800 more than five years ago (Zillow Home Value Index, September 2026).
How long are homes taking to sell in Flagstaff & Coconino County?
88 days is the typical time on the market in September 2026, and about 150 of the 765 homes for sale have cut their price (Realtor.com).
Is now a good time to sell in Flagstaff & Coconino County?
With 4.4 months of supply, Flagstaff & Coconino County is a balanced market right now: homes priced right still sell, and homes priced high sit.
Where in Flagstaff & Coconino County are home prices highest and lowest?
By Zillow's typical home value, ZIP 86005 is highest at $723,998 and ZIP 86320 (Ash Fork) is lowest at $205,040. The ZIP table above has every ZIP code here.
Where does Flagstaff & Coconino County rank among Arizona's housing markets?
By days on market, Flagstaff & Coconino County is 22nd fastest of the 24 Arizona local markets with a page here, at 88 days. The fastest is Marana at 57 days and the slowest Payson & Gila County at 91 (Realtor.com, September 2026).
Who's behind it

Our founder, Bryce Henderson, is a real estate investor, veteran and paramedic. Our team talks with Arizona homeowners about every way to sell and what each one would leave them. More about him and HERO Real Estate Investors at herorei.com.
Sources: Zillow Research, Realtor.com Research, Redfin Data Center, Freddie Mac, U.S. Census Bureau, U.S. Treasury, county property and recorder records, and a private property data company. Figures refresh as each source publishes. How we compute every number.
See what homes like yours sold for.
Free for Arizona homeowners. No account needed.